Tracks of storms hit Vietnam from the East Sea during the past 70 years
Criteria and scope of assessment are agreed by P-GIS as follows:
- Selecting the storms and tropical depressions hit the mainland: Storm track must go through the mainland of Vietnam.
- If a storm goes through a province, it is considered as a storm-hit-province. That is not the case of nearby provinces only be affected by the storm.
With the above rule, this analysis may not really reflect the impact of storms in a province adjacent to the storm track but is not counted as a storm-hit-province. However, looking at the statistics over the years, we can see that Vietnam and its people have been experiencing many difficulties as affected by natural disasters. Here are some analysis criteria conducted by P-GIS:
- The province hit by the most storms
- The province had the highest warning level
- The year with the highest number of storms
- The month with the most storms
- The most common cyclone speed
- The name of the storm which is considered as the most super storm
The province was hit by the most storms
|
Province
|
Number of storms
|
|
Đà Nẵng city
|
41
|
|
Khánh Hòa
|
32
|
|
Quảng Ninh
|
30
|
|
Hà Tĩnh
|
24
|
|
Thanh Hóa
|
23
|
|
Quảng Bình
|
22
|
|
Bình Định
|
18
|
|
Nghệ An
|
18
|
|
Gia Lai
|
17
|
|
Đắk Lắk
|
14
|
Over the past 70 years, Da Nang and Khanh Hoa have the biggest number of storms and tropical depressions. This figure does not take into account of the storm intensity but only reflects the quantity. On average, in each of these two provinces, 1 storm/year directly hit the province.
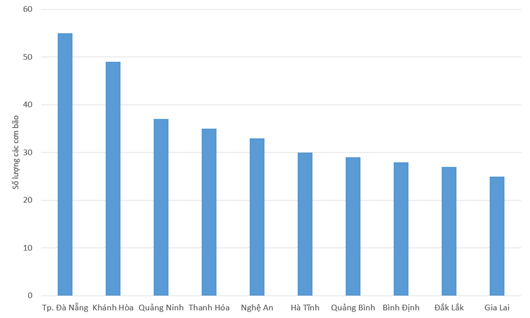
Provinces have the biggest number of storms during the past 70 years
The province had the highest warning level
The warning level of a storm is defined by the term “Advisory” initiated by the US National Meteorological Agency. On the current scale, the warning level is graded from 1-100, accordingly, strong storms often have a warning level of 45-50.
|
Storm
|
Province
|
Warning level
|
Year
|
|
WAYNE
|
Nghệ An
|
85
|
1986
|
|
WAYNE
|
Thanh Hóa
|
84
|
1986
|
|
PARMA
|
Tp. Hải Phòng
|
68
|
2009
|
|
ANGELA
|
Tp. Đà Nẵng
|
66
|
1995
|
|
CARY
|
Nghệ An
|
64
|
1987
|
|
CARY
|
Hà Tĩnh
|
63
|
1987
|
|
KORYN
|
Tuyên Quang
|
63
|
1993
|
|
KORYN
|
Bắc Giang
|
62
|
1993
|
|
SARAH
|
Gia Lai
|
59
|
1979
|
|
SARAH
|
Phú Yên
|
58
|
1979
|
|
CARY
|
Tp. Đà Nẵng
|
58
|
1987
|
|
ANGELA
|
Kiên Giang
|
57
|
1992
|
|
COLLEEN
|
Kon Tum
|
55
|
1992
|
|
COLLEEN
|
Bình Định
|
54
|
1992
|
|
ED
|
Nghệ An
|
54
|
1990
|
|
TERESA
|
Đồng Nai
|
53
|
1994
|
|
SHARON
|
Ninh Thuận
|
53
|
1991
|
|
04W
|
Quảng Nam
|
53
|
1994
|
|
TERESA
|
Bà Rịa-Vũng Tàu
|
52
|
1994
|
|
ED
|
Hà Tĩnh
|
52
|
1990
|
|
THELMA
|
Bà Rịa-Vũng Tàu
|
51
|
1991
|
|
IDA
|
Hà Giang
|
51
|
1954
|
|
MAURY
|
Khánh Hòa
|
51
|
1987
|
|
ANGELA
|
Quảng Bình
|
51
|
1989
|
|
ED
|
Quảng Bình
|
51
|
1990
|
|
IDA
|
Bắc Cạn
|
50
|
1954
|
|
NANCY
|
Hà Tĩnh
|
50
|
1954
|
|
MIKE
|
Quảng Ninh
|
50
|
1990
|
The warning level referred in the above table shows the average valid of all storms hit the provinces during 70 years. It is clear that Hải Phòng, Thanh Hóa and Nghệ An suffered storms with the highest level of warning.
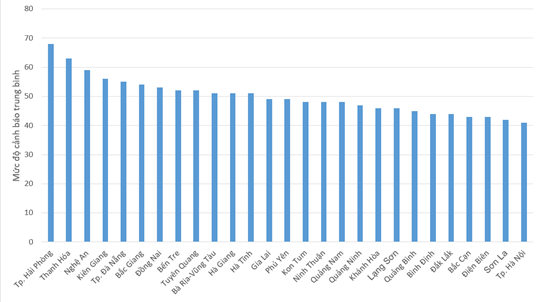
The average warning level in 70 years for the first ranking provinces
In agricultural production planning, the use of information on the level of storm warning will help planners to select the right plant groups that are better suited to local conditions, especially resistant to strong winds and heavy rain.
The year with the highest number of storms
The number of storms and tropical storms does not cover all the devastation of natural disasters, but partly shows the severious damages that people in the storm-hit location had suffered. For tropical storms, heavy rain always accompany with whirlwinds. Therefore, when a country suffers a big number of storms, it is also mean it is seriously affected by natural disasters in the same year.
Below is a list of the top 10 years with the biggest number of storms during the past 70 years.
|
Year
|
Number of storms
|
|
1973
|
23
|
|
1972
|
18
|
|
1990
|
18
|
|
1964
|
15
|
|
2018
|
15
|
|
1952
|
14
|
|
1983
|
14
|
|
1994
|
14
|
|
1995
|
14
|
|
1974
|
13
|
This is a statistic across Vietnam in years. It shows that 1973 was the "peak" year with the biggest number of storms hitting Vietnam. Although storms’ intensity may not be as strong as those of 1989 or 1994, this record is far from broken.
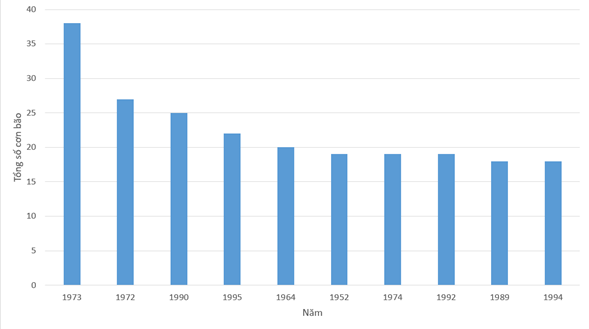
The top 10 years have the biggest number of storms and tropical depression hiting Vietnam
The month with the most storms
Most Vietnamese people know that the storm season starts in July and ends in November every year. However, to get a better look at the statistics, take a reference from the table below.
|
Month
|
Number of storms
|
|
1
|
4
|
|
3
|
4
|
|
4
|
4
|
|
5
|
9
|
|
6
|
28
|
|
7
|
50
|
|
8
|
66
|
|
9
|
94
|
|
10
|
97
|
|
11
|
82
|
|
12
|
21
|
Over the past 70 years, the Septembers and Octobers of calendar months have been two "champions" of the biggest number of storms and tropical depression hitting Vietnam.
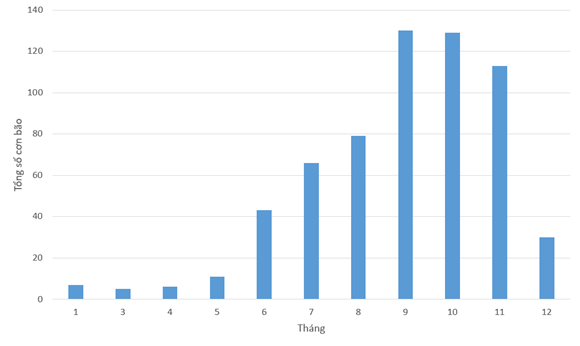
The number of storms hit Vietnam is accounted by month in the past 70 years
The most common cyclone speed
Despite the number of storms is big, but cyclone speed is one of the factors determining storms’ devastation. Cyclone speed is measured in meters/second (m/s) at many points along the storm track. According to P-GIS statistics, the most popular cyclone speed in the past 70 years was recorded from 618 storms of 30 (m /s), followed by 25 (m /s) and 35 (m). /S). The cyclone speed in storms in Vietnam ranges from 25-40 (m /s) is the most common.
|
Speed (m/s)
|
Number of storms
|
|
85
|
2
|
|
95
|
2
|
|
80
|
4
|
|
100
|
4
|
|
10
|
5
|
|
75
|
7
|
|
70
|
9
|
|
90
|
10
|
|
65
|
20
|
|
60
|
24
|
|
55
|
27
|
|
15
|
28
|
|
50
|
35
|
|
45
|
48
|
|
20
|
60
|
|
40
|
61
|
|
35
|
82
|
|
25
|
84
|
|
30
|
106
|
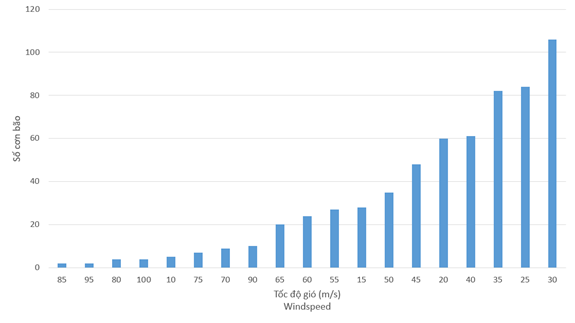
Statistics of the most common gusts of wind speed in the past 70 years
According to wind scale Beaufort (https://en.wikipedia.org/wiki/Thang_s%E1%BB%A9c_gi%C3%B3_Beaufort), the prevailing cyclone speed during storms in Vietnam is from level 6 to level 9 .
The name of the storm which is considered as the most super storm
The name of the storm with the highest warning level was referred as "Wayne" occurring in September 1986 in Thanh Hoa and Nghe An provinces. This can be called "super typhoon" as the term is being called by quite common use on the media today.
|
Name of storms
|
Warning Level
|
Year
|
Month
|
Province
|
|
WAYNE
|
85
|
1986
|
9
|
Nghệ An
|
|
WAYNE
|
84
|
1986
|
9
|
Thanh Hóa
|
|
PARMA
|
68
|
2009
|
10
|
Tp. Hải Phòng
|
|
ANGELA
|
66
|
1995
|
11
|
Tp. Đà Nẵng
|
|
CARY
|
64
|
1987
|
8
|
Nghệ An
|
|
CARY
|
63
|
1987
|
8
|
Hà Tĩnh
|
|
KORYN
|
63
|
1993
|
6
|
Tuyên Quang
|
|
KORYN
|
62
|
1993
|
6
|
Bắc Giang
|
|
KORYN
|
61
|
1993
|
6
|
Bắc Giang
|
|
SARAH
|
59
|
1979
|
10
|
Gia Lai
|
|
CARY
|
58
|
1987
|
8
|
Tp. Đà Nẵng
|
|
SARAH
|
58
|
1979
|
10
|
Phú Yên
|
|
ANGELA
|
57
|
1992
|
10
|
Kiên Giang
|
|
ANGELA
|
55
|
1992
|
10
|
Kiên Giang
|
|
COLLEEN
|
55
|
1992
|
10
|
Kon Tum
|
|
ED
|
54
|
1990
|
9
|
Nghệ An
|
|
COLLEEN
|
54
|
1992
|
10
|
Bình Định
|
|
ED
|
53
|
1990
|
9
|
Nghệ An
|
|
SHARON
|
53
|
1991
|
3
|
Ninh Thuận
|
|
TERESA
|
53
|
1994
|
10
|
Đồng Nai
|
|
ED
|
52
|
1990
|
9
|
Hà Tĩnh
|
|
TERESA
|
52
|
1994
|
10
|
Bà Rịa-Vũng Tàu
|
The intensity of wind gustsed over the years
If making a comparison of the average gusting speed of all storms in a year, a small finding shows that the gusting speed tends to increase time by time, in the cycle from 1945 to present. This rule may not be right in the future but the numbers do not lie.
|
Year
|
Speed (m/s)
|
|
1945
|
35
|
|
1946
|
38
|
|
1947
|
37
|
|
1948
|
30
|
|
1950
|
30
|
|
1951
|
53
|
|
1952
|
38
|
|
1953
|
50
|
|
1954
|
50
|
|
1955
|
32
|
|
1956
|
49
|
|
1957
|
55
|
|
1959
|
45
|
|
1960
|
45
|
|
1962
|
43
|
|
1963
|
36
|
|
1964
|
42
|
|
1965
|
32
|
|
1966
|
40
|
|
1967
|
38
|
|
1968
|
39
|
|
1969
|
49
|
|
1970
|
35
|
|
1971
|
49
|
|
1972
|
79
|
|
1973
|
27
|
|
1974
|
25
|
|
1975
|
31
|
|
1976
|
18
|
|
1977
|
30
|
|
1978
|
33
|
|
1979
|
25
|
|
1980
|
28
|
|
1981
|
36
|
|
1982
|
49
|
|
1983
|
41
|
|
1984
|
32
|
|
1985
|
40
|
|
1986
|
37
|
|
1987
|
39
|
|
1988
|
43
|
|
1989
|
41
|
|
1990
|
38
|
|
1991
|
35
|
|
1992
|
35
|
|
1993
|
47
|
|
1994
|
25
|
|
1995
|
38
|
|
1996
|
45
|
|
1997
|
52
|
|
1998
|
37
|
|
1999
|
35
|
|
2000
|
38
|
|
2001
|
47
|
|
2003
|
58
|
|
2004
|
54
|
|
2005
|
37
|
|
2006
|
63
|
|
2007
|
38
|
|
2008
|
31
|
|
2009
|
57
|
|
2010
|
45
|
|
2011
|
48
|
|
2012
|
59
|
|
2013
|
57
|
|
2014
|
60
|
|
2015
|
32
|
|
2016
|
36
|
|
2017
|
50
|
|
2018
|
27
|
Trend in the 70-year data shows that there is a basis for the above assumption. Although the variables are still quite up and down, lack of stability, the general trend is still going up.
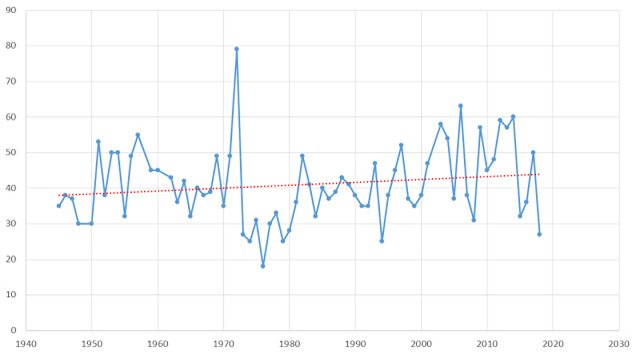
Increasing trend of average wind speed of storms during the year
In the spirit of providing analysis data in an objective manner, P-GIS will not give any comment on these storms and their damages. The team has only used reliable data and recognized statistical analysis methods. The analytical data included data sheets and maps of 227,000 storms across the Asia-Pacific region. After overlapping with the Vietnam boundary map, we selected 618 storms that directly hit the mainland for the analysis.
For original data, please contact P-GIS Admin by email.