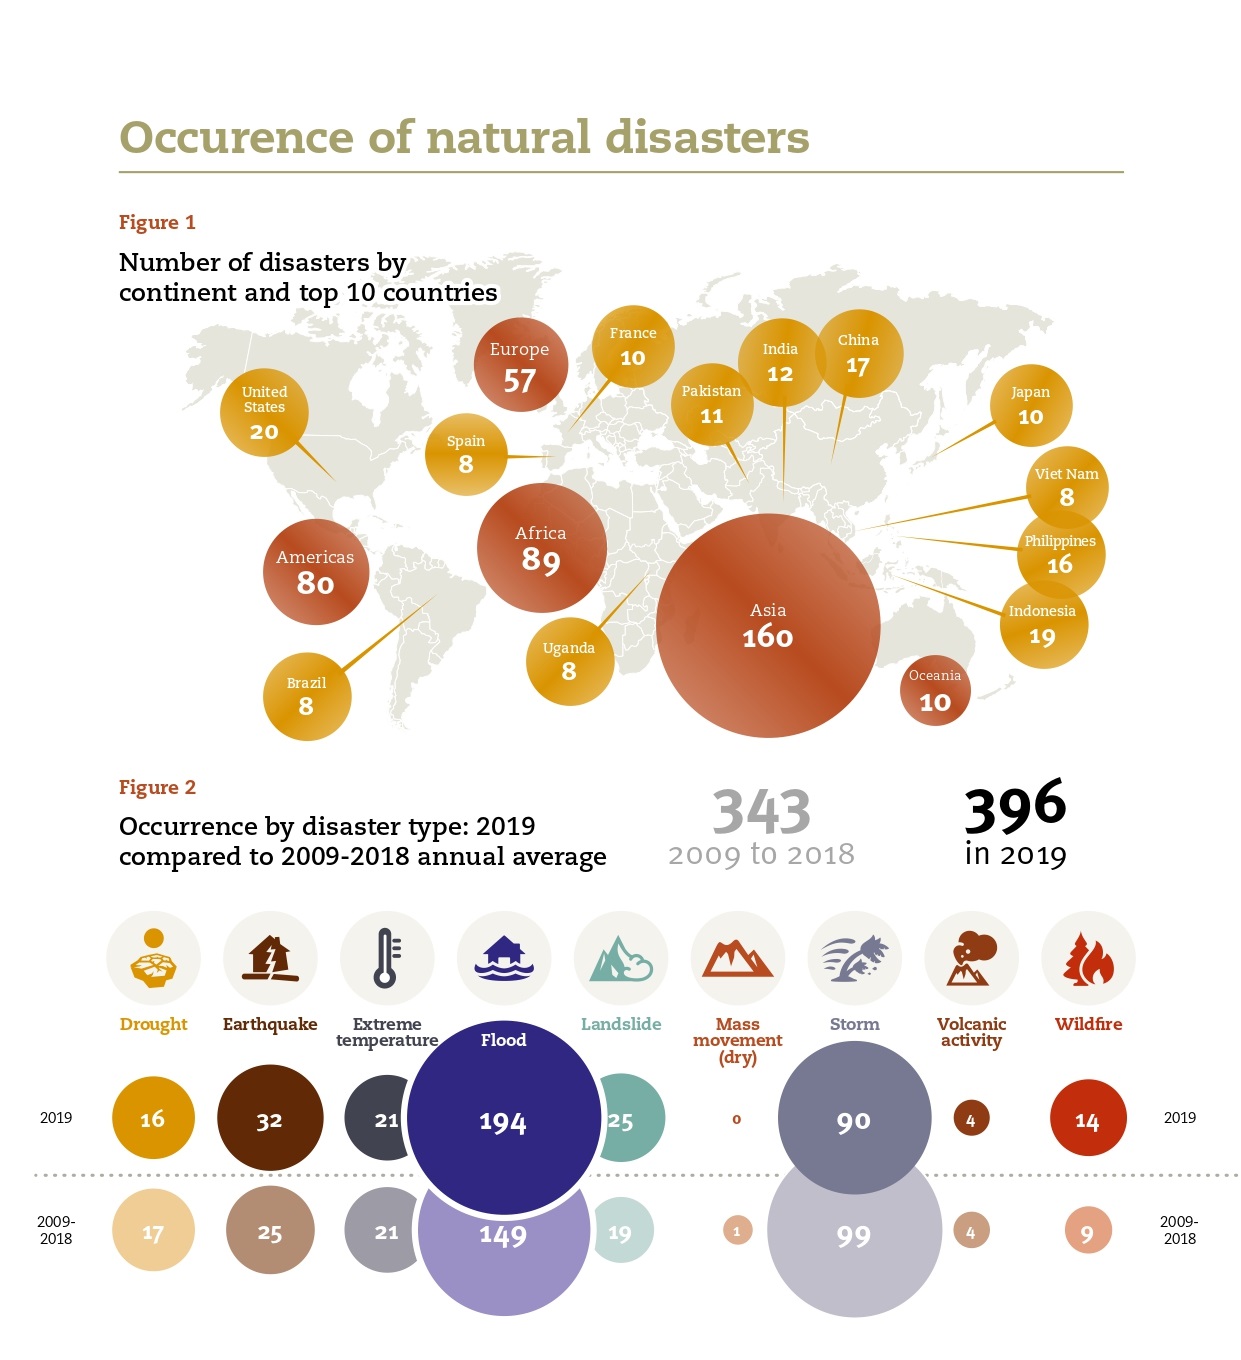
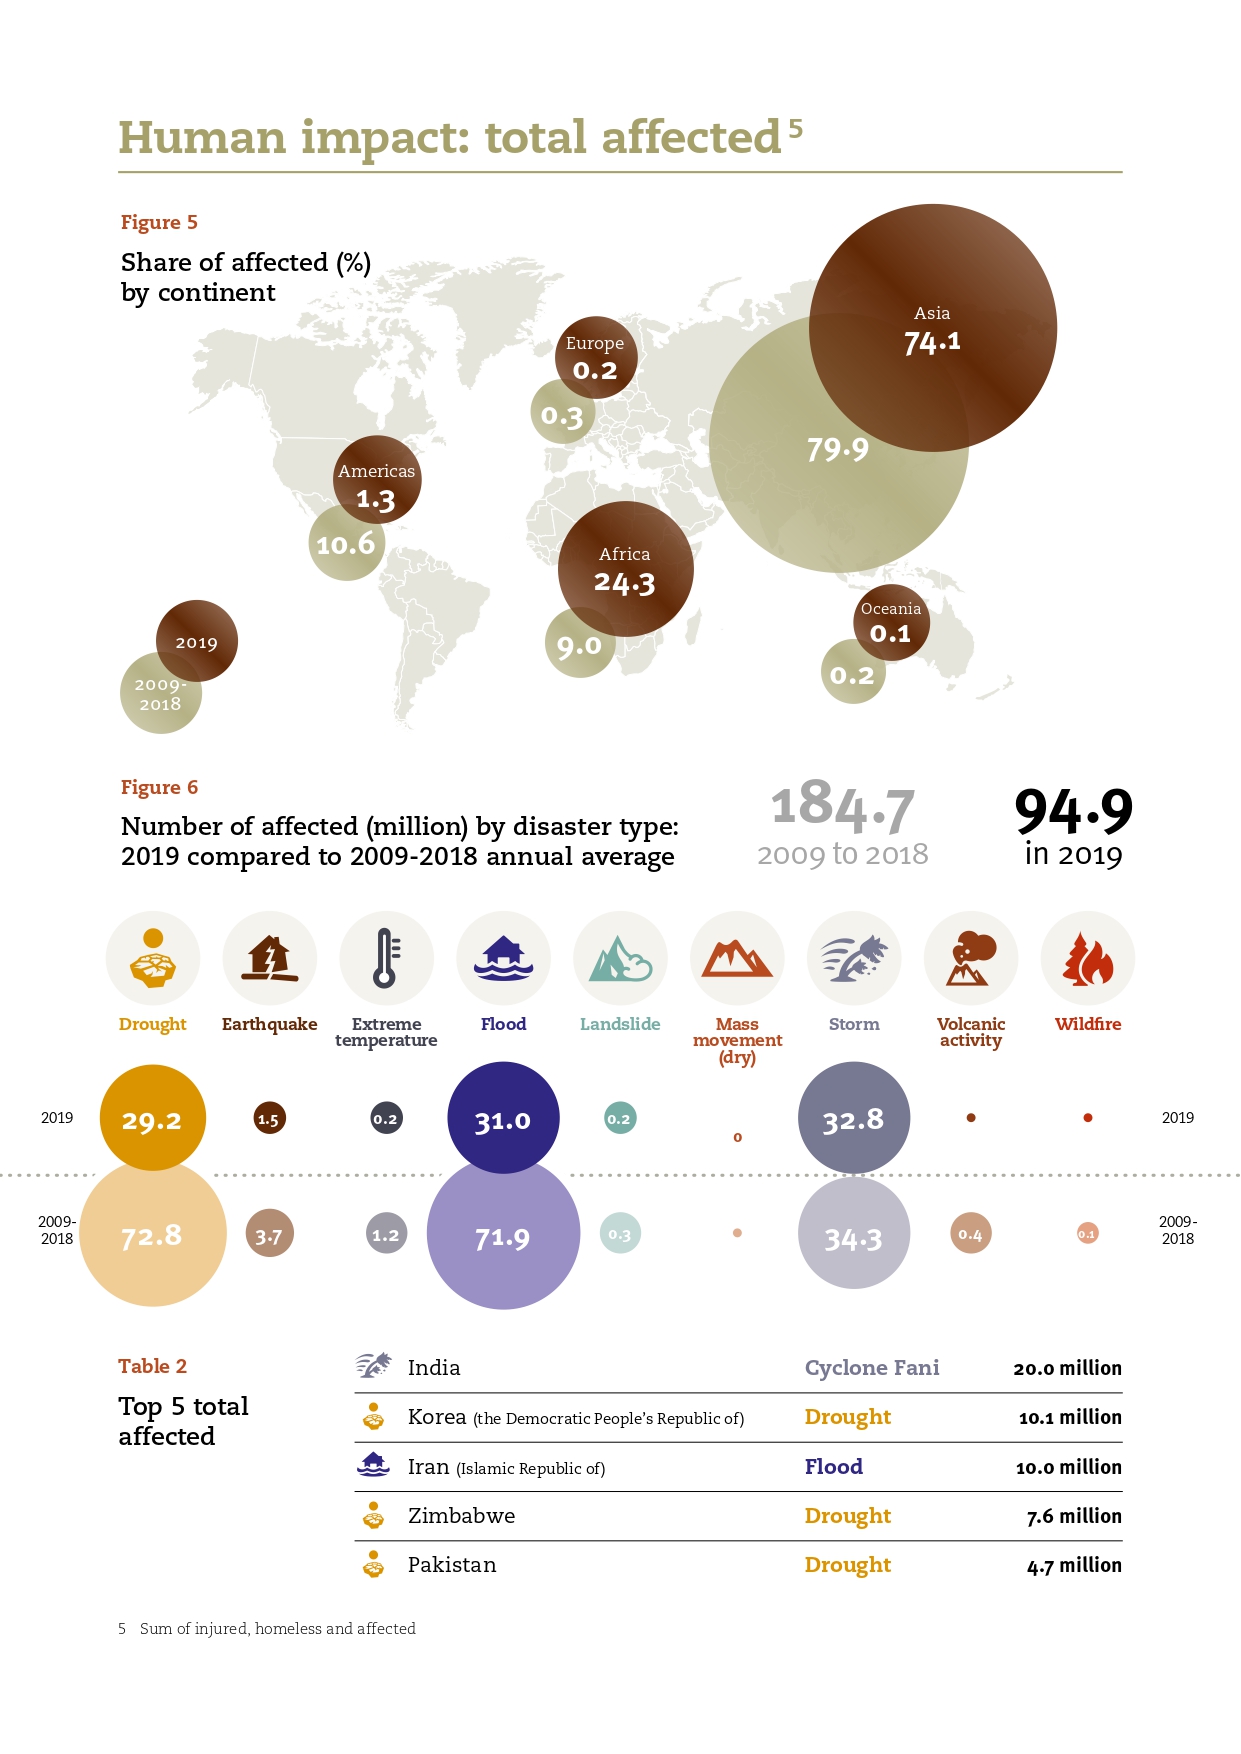
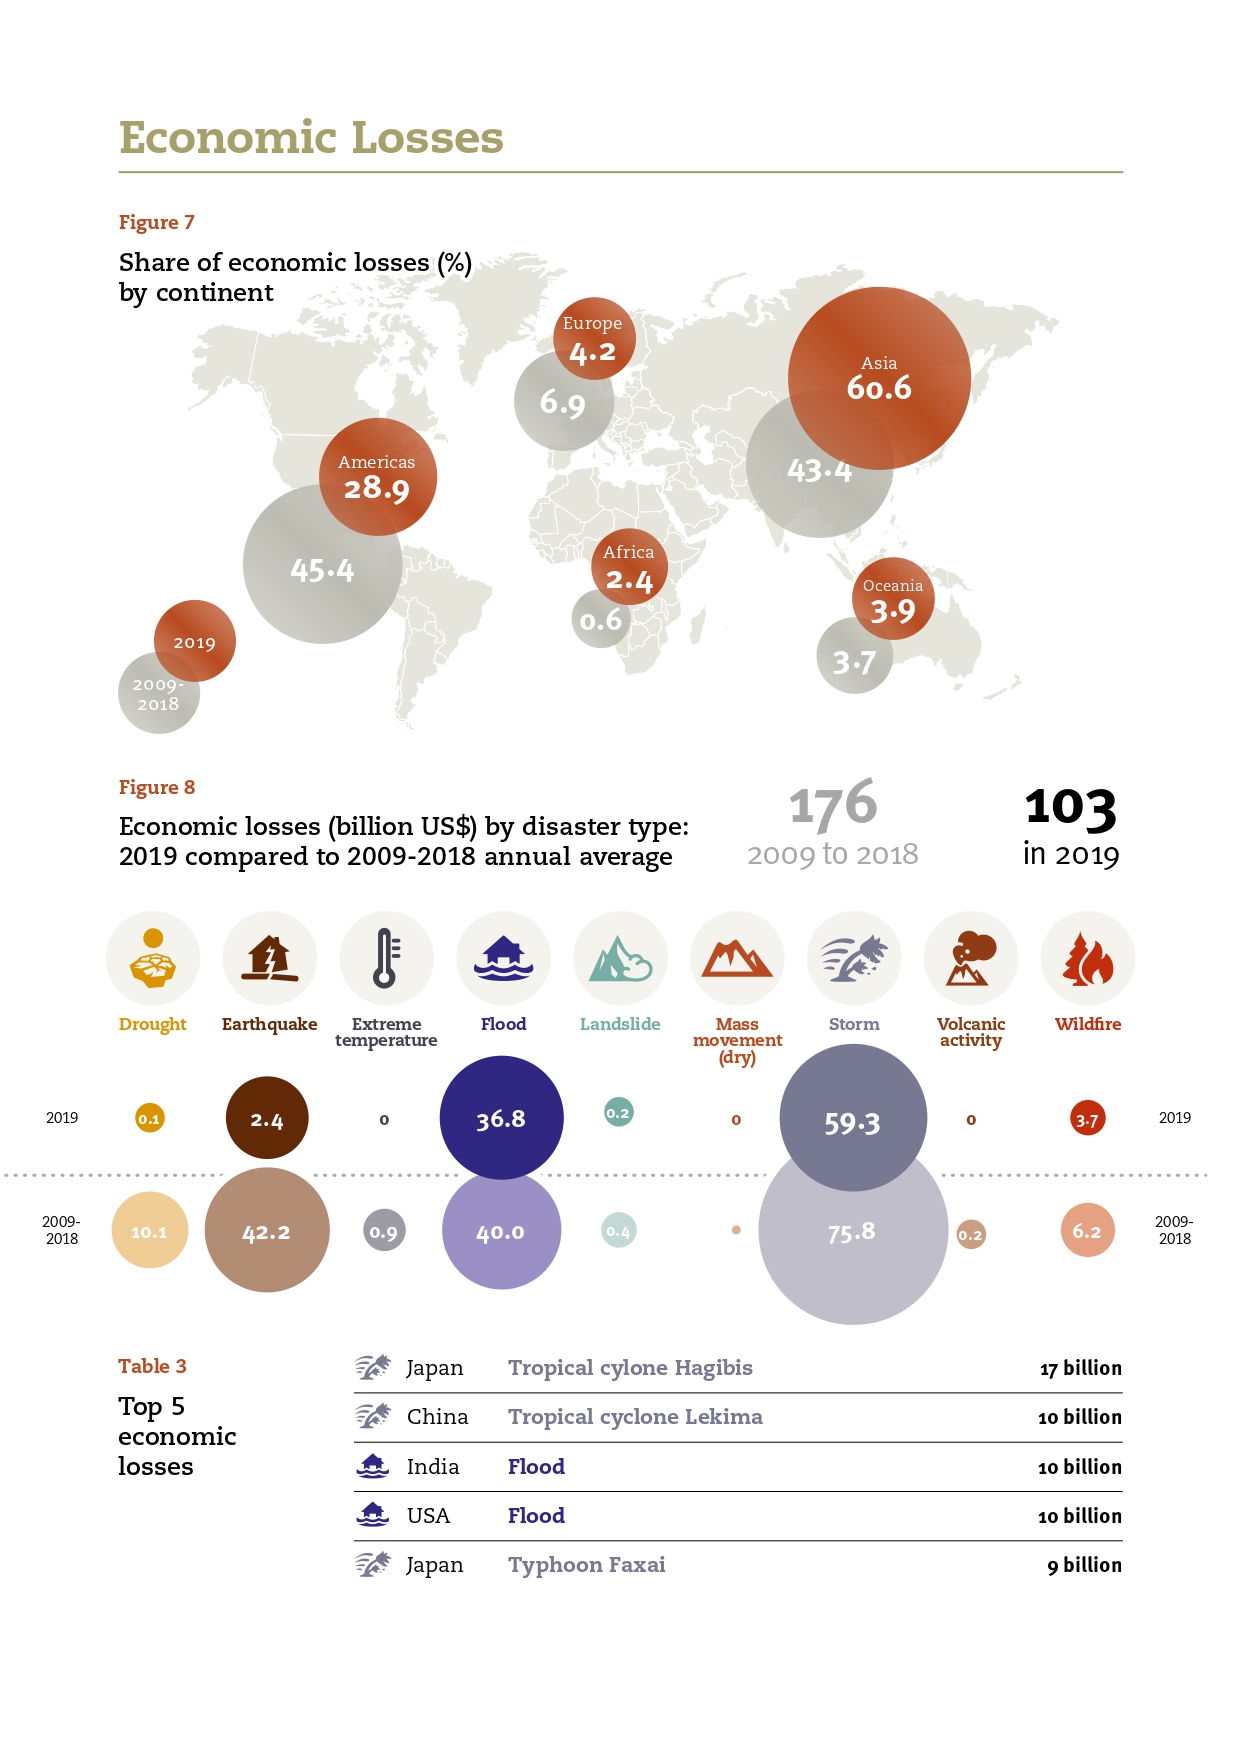
In comparison to the previous decade (2009-2018), in 2019 there were more disasters compared to the annual average of 343 events, fewer deaths compared to the annual average of 45,212, fewer number of people affected compared to the annual average of 184.7 million people, and lower economic losses compared to the annual average of $176 billion. This decrease in impact is due to the absence of massive disaster events such as the 2010 earthquake in Haiti (222,500 deaths); the 2015 / 2016 drought in India (330 million people affected); and the 2011 Japan earthquake and tsunami ($210 billion in damages).
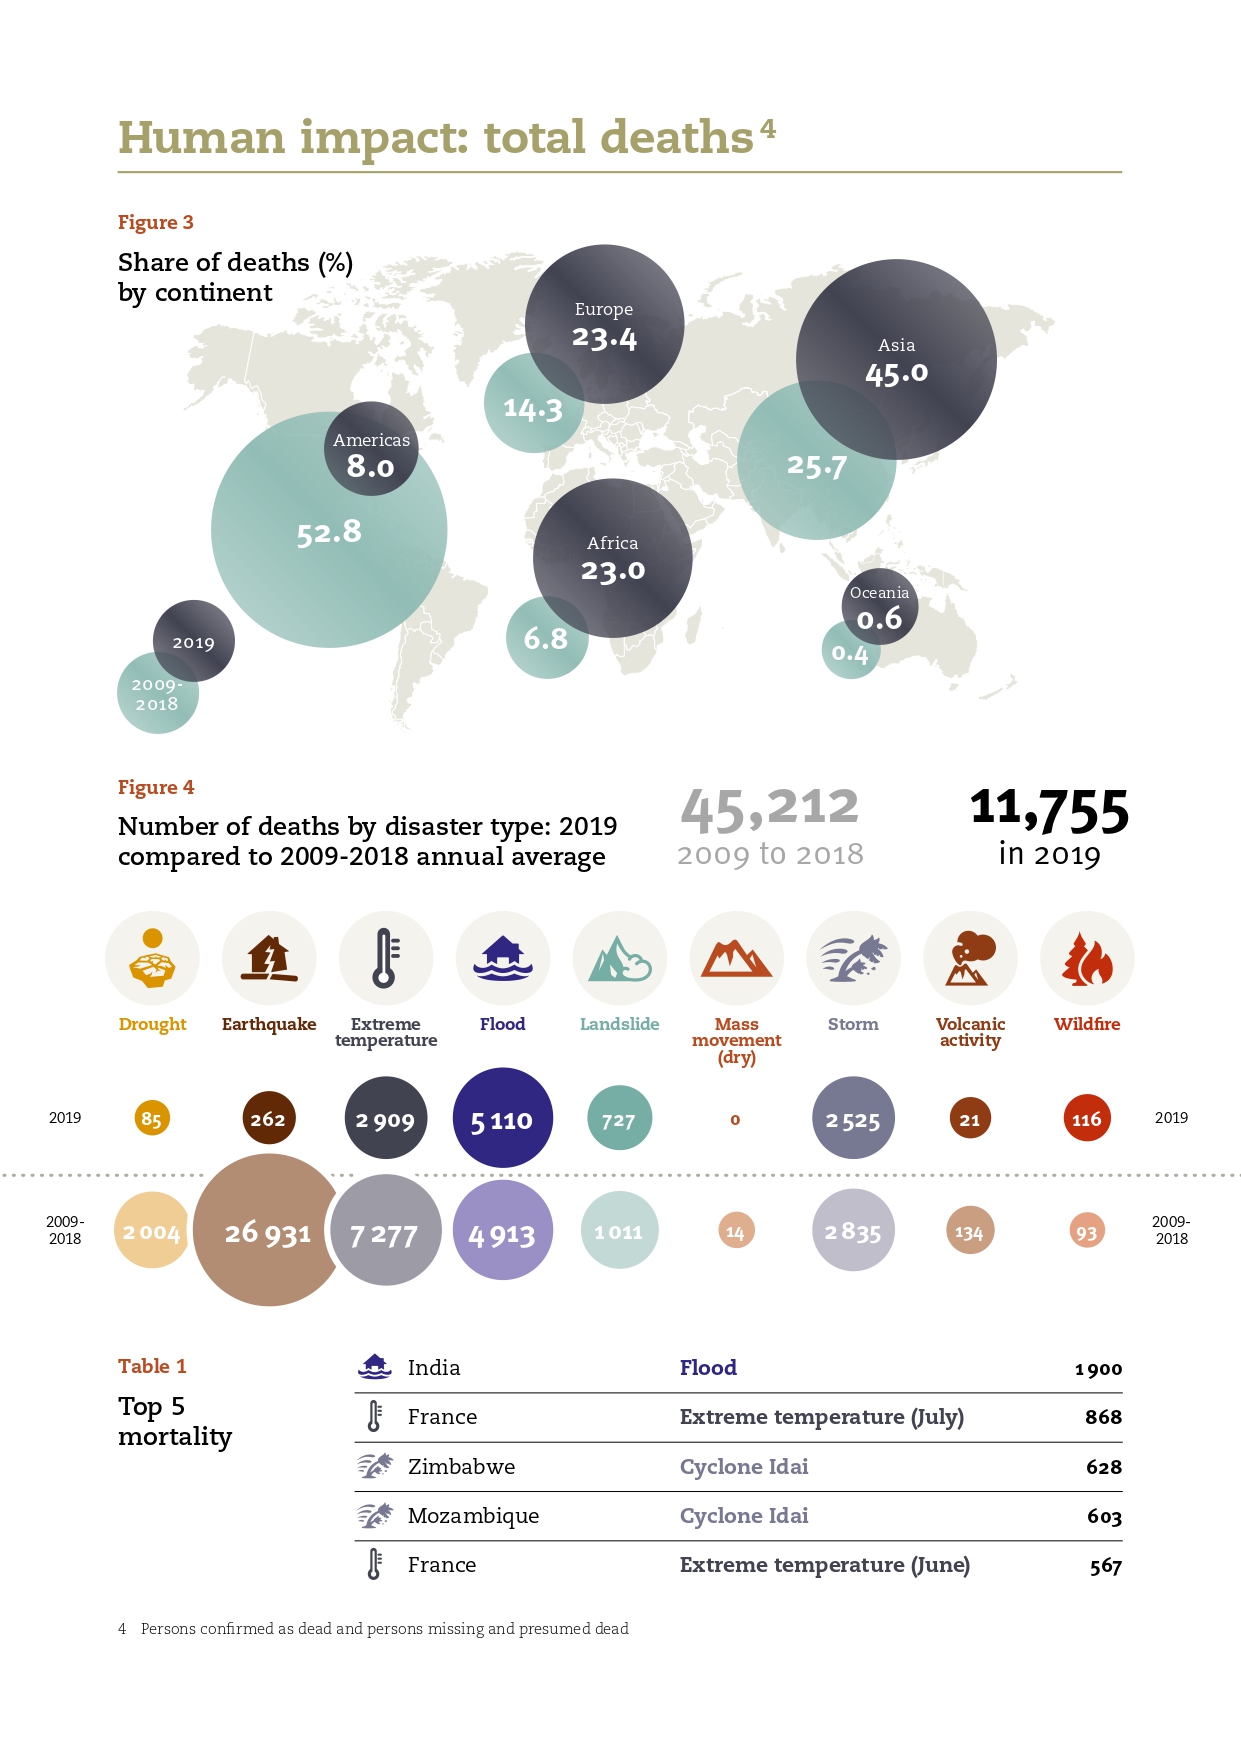
The deadliest events recorded in 2019 were the summer heat waves that affected Europe, more specifically France, Belgium and the Netherlands, with over 2500 deaths. The National Oceanic and Atmospheric Administration (NOAA) ranked 2019 as the second warmest year on record. Temperature records were also shattered on individual country levels: for the first time, Belgium and the Netherlands recorded temperatures over 40°C. In general, the impact of heat waves remains grossly underestimated. This is primarily due to underreporting in developing countries, where temperatures often exceed European values by a large margin and local populations have limited possibilities to protect themselves from heat wave exposure.
The following most deadly event consisted of the flood in India due to the high monsoon rains, which lasted from July to October and affected 13 states (mainly in the North) and caused nearly 2000 dead. Two storms were the next deadliest: cyclone Idai affected central Mozambique and Zimbabwe (March) with over 1200 deaths / missing; and storm Dorian affected the United States and the Bahamas in September with at least 358 deaths / missing. We recorded more than twice as many floods (194) as storms (91) this year, both types affecting nearly 64 million people worldwide. The African continent was particularly affected by storms in 2019: 11 recorded events accounted for a total of 1300 deaths and affected over 4.5 million people. One month after cyclone Idai, Mozambique was hit by another cyclone in the north, Kenneth, which is considered to be the strongest cyclone to ever hit the African continent.
Fortunately, cyclone Kenneth’s official death toll was much lower than Idai’s, with only 45 fatalities reported. Nevertheless, the cyclone left nearly 400,000 people in need of humanitarian assistance in a country still struggling from the previous disaster.
The deadliest geophysical event was the earthquake that hit Albania in November, and which killed 51 people. There was only one volcanic eruption with a deadly impact in 2019, namely the White Island eruption in New Zealand in December. This event was broadly covered by the media.
The year was also marked by large wildfires around the world which caught the public’s attention. The total damage and economic cost should reached 30 billion US$ in 2019. This estimate is likely to change in the future once there is more precise insight on the exact impact. At least 14 wildfires started in 2019, of which the most important were:
- California/USA (Kincade, Saddleridge and Sandalwood fires, October) with low human impact reported but with total damages estimated at 1.3 billion US$;
- Multi country event in South America/Amazonia for which it is quite difficult to have realistic figures on the human impact and the causal factors (both human and natural).
- Australia (September 2019 to February 2020): these long lasting wildfires led to 32 deaths, burned over 6 million hectares of forest and bush, killed almost
500 million animals, destroyed thousands of homes and forced hundreds of thousands of people to evacuate.
Overall, the most notable features of the year included: large, severe and long-lasting wildfires which captured international attention and had dramatic impacts on the environment, even if the human impact was less severe than in previous years, and multiple heat waves during summer time with record temperatures in several European countries.
Globally, 4.1 billion people were potentially exposed to natural disasters in 2019. When compared side by side, the figures of population potentially exposed (PPE) to certain types of disasters present great differences in size. For example, floods and storm can affect wide areas of land, potentially reaching 2.9 and 1.9 billion people in the world respectively while earthquakes (142.9 million PPE) and wildfires (91 million PPE) tend to affect more specific regions. Although fewer people are potentially affected by wildfires, they are cyclical in some areas and therefore have a great influence on local populations.
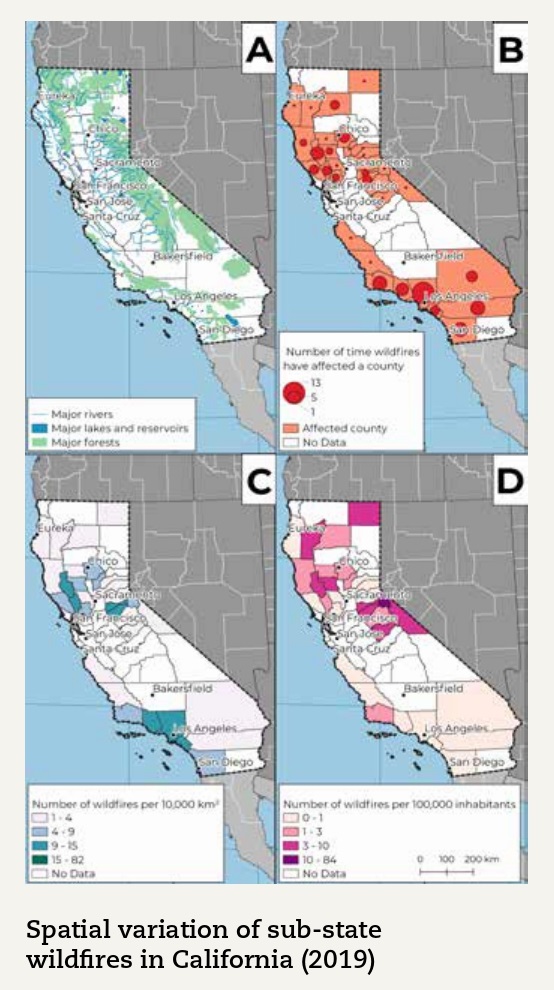
During 2019, wildfires had a devastating economic impact on the United States of America. California was again severely impacted. However, the Californian population is not affected equally, and some spatial variation can be noted.
To better show spatial variation within the state, the maps display only wildfires for which information about their footprints was available at a sub-state level. By doing so, 6 disasters are omitted since they affected practically the entire state.
Located in the south of California, the counties around the city of Los Angeles (Ventura, San Bernardino and Orange) are among the most affected areas with between 3 and 13 wildfires in 2019 (map B). The counties north of the city of San Francisco and around the city of Sacramento were also severely affected by wildfires, but not as often as the southern counties. However, these counties show a wide variation in area. When the number of wildfires per county is controlled for the size of the county (map C), this difference is reduced. When showing the number of wildfires by population, other counties are hardest hit. The northern counties of California and the ones on the east of Sacramento are among the counties with the highest number of wildfires per inhabitant (map D).
Since 2014, EM-DAT also georeferences the main types of natural disasters: earthquakes, volcanic activities, mass movements (dry), floods, landslides, storms, extreme temperatures, droughts and wildfires. We have georeferenced disaster footprints for all events from 2000 onwards. Based on different sources of information, the affected areas, also known as the disaster footprint, can be delimited by extracting the corresponding administrative units from the GAUL (Global Administrative Unit Layers) spatial dataset. This process adds values to the data for analysis at a sub-national scale.
About EM-DAT
Since 1988, CRED has maintained the Emergency Events Database (EM-DAT). Initially created with the support of the WHO and the Belgian government, the main objectives of EM-DAT are to inform humanitarian action at the national and international levels in order to improve rational decision-making in disaster preparedness, provide objective data for assessing communities’ vulnerability to disasters and help policy-makers set priorities.
EM-DAT contains core data on the occurrence and effects of more than 24,000 natural and technological disasters from 1900 to the present day. It is compiled from various sources (UN agencies, the US Office of Foreign Disaster Assistance, national governments, the International Federation of Red Cross and Red Crescent Societies, NGOs, insurance companies, research institutes and the media) according to a priority list.
CRED defines a disaster as “a situation or event that overwhelms local capacity, necessitating a request at the national or international level for external assistance; an unforeseen and often sudden event that causes great damage, destruction and human suffering”. Only natural disasters (biological excluded) are included in this publication. For a disaster to be entered into the database, at least one of the following criteria must be fulfilled:
- 10 or more people reported killed
- 100 or more people reported affected
- declaration of a state of emergency
- call for international assistance
Since 2014, EM-DAT also georeferences natural disasters, adding geographical values to numeric data which is essential for deeper analysis.
Acknowledgements: The data used in this report is maintained through the long-term support of the US Agency for International Development’s Office of Foreign Disaster Assistance (USAID/OFDA). This report was put together at CRED by Regina Below, Valentin Wathelet and Remi Froment. We are also grateful to MARDI for the layout and printing.
We encourage the free use of the contents of this report with appropriate and full citation:
CRED. Natural Disasters 2019. Brussels: CRED; 2020. This document is available at: https://emdat.be/ sites/default/files/adsr_2019.pdf
Centre for Research on the Epidemiology of Disasters (CRED)
Institute Health and Society UClouvain B.1.30.15, Clos Chapelle aux Champs 1200 Brussels, Belgium